

Introduction to how to make a chart active (the same state as when clicked) in Office Scripts.
Operations
You must first get the target chart.
chart variable = workbook.getWorksheet("Sheet name").getCharts()[index];chart variable = workbook.getWorksheet("Sheet name").getChart("Chart name");This can also be done with the return value (variable) of the result added with addChart().
If the acquisition fails, the result is undefined.
The chart name specified to getChart() is displayed in the name box.

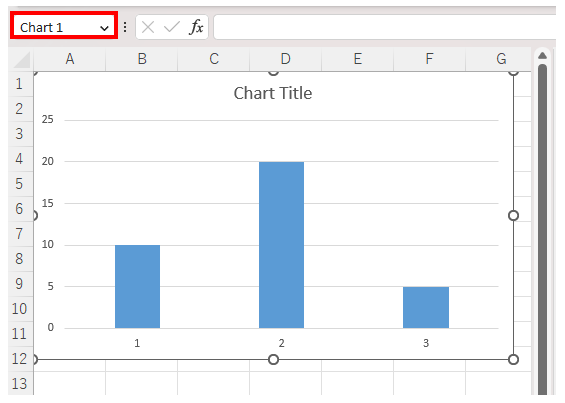
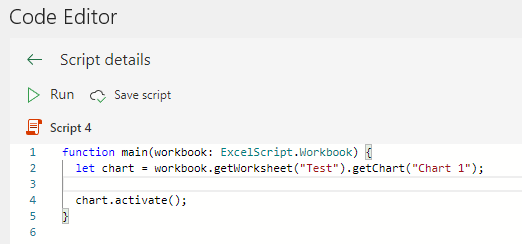
chart variable.activate();function main(workbook: ExcelScript.Workbook) {
let chart = workbook.getWorksheet("Test").getChart("Chart 1");
chart.activate();
}
For those who want to learn Office script effectively

The information on this site is now available in an easy-to-read e-book format.
Or Kindle Unlimited (unlimited reading).


You willl discover how to about basic operations.
By the end of this book, you will be equipped with the knowledge you need to use Excel Office Script to streamline your workflow.